


PWM Motor Control

Update: 24 Feb 2013: I don’t normally change Musings once they’re posted, but there was a serious problem with the DZ125 section. I’m not sure why, but the scope traces were very wrong (I suspect a loose wire, although it may be the scope). I redid the connections, reset the decoder and the scope, recalibrated the scope, and made some new traces, and have replaced the bad ones and rewritten the text to match the new ones.
Note: there’s an updated and extended version of the PWM discussion here on my DCC Motor Control page now.
DC motors are controlled by varying the voltage and polarity of the DC power connected to them. In a simple DC power-pack a rheostat is used to provide a voltage to the track that varies from zero volts to the power pack’s maximum, which is often around 16 Volts. A simple switch is used to swap the positive and negative outputs to change the polarity (and thus the direction the motor turns). This tends to waste a lot of power as heat, but since that’s happening inside the power pack (and “a lot” isn’t really all that much at these voltages) that’s acceptable.
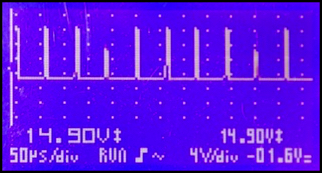
DCC decoders need to take a constant-voltage AC input from the rails, and control a DC motor somehow. Even if they could use a rheostat, wasting power as heat inside a plastic model is more problematic. The technique normally used instead is called Pulse-Width Modulation, and it’s a fairly simple and commonplace, and efficient, method of controlling DC motors from a digital controller. The same technique is used in many other applications. The image up above is an oscilloscope trace showing the pulses of a PWM motor controller operating at 15 volts and about 16 kHz.
It’s very straightforward: the AC signal is first converted to DC in a rectifier, providing a constant DC voltage which is also often around 16 volts, and the DC is then sent to the motor through a controller. The controller doesn’t just send the voltage constantly though, instead it can be turned on and off very quickly. If it’s mostly on, the motor is getting near full voltage, if the interruptions are more frequent or longer, and it’s mostly off, the motor is getting very little average voltage, even though the peak voltage is still quite high. The polarity can also be reversed in a manner similar to the power pack, and this too is a function of the motor controller.
Decoder Design and PWM Frequency
In a modern decoder, most of the functions are handled in a microprocessor, and the motor controller is often part of the same chip. In older designs, or for higher-power outputs, these can be separate chips. Because microprocessors continue to get smaller and faster, newer designs can do more processing in the same space, leading to features like Back Electro-Motive Force feedback control (commonly called BEMF) and high-frequency PWM (called “supersonic” output). The microprocessor will set the motor controller to output a specific average power (called a “duty cycle”) and then go off and do other things. The motor controller is a tiny bit of hardware that will output PWM with the requested duty cycle until told to change it.
For example, in the photo up above, a TCS M1 decoder’s motor output (orange and gray wires) is measured with the throttle set at step 64 (out of 126), or roughly half power. The power is being pulsed every 62.5 microseconds, or at a frequency of 16,000 Hz. That means that the vibrations created in the motor by turning the power on and off in the PWM signal will have a frequency of 16 kHz. That’s not quite “supersonic”, but it’s going to be hard to hear for the average older modeler. The decoder CPU will have set the motor controller to produce that duty cycle after it processed the DCC command from the throttle that said “set speed step 64”. Once it did, the motor controller will keep on doing it until the CPU tells it otherwise.
The frequency of the PWM cycle (what I’ll call the base frequency for reasons that will become clear in a bit) is controlled by how the decoder’s motor control circuitry is built, and to a limited extent can be altered by making changes to how it is set up by the CPU (this is why some decoders can let you turn off “supersonic” PWM). The choice of what this frequency should be is not a simple matter.
Hearing loss happens progressively with age, making it harder to hear all sounds. But the effect is magnified at higher frequencies. It’s not so much that older people can’t hear higher frequencies, but that their (our) sensitivity to them drops, making it harder to hear quiet higher frequencies. A loud motor close up at 16 kHz is likely still audible to 50-year-old who couldn’t hear it ten feet away. Whereas an 18-year-old probably hears both equally well. So a decoder that’s “supersonic” at 16 kHz is likely still audible if you listen close (unless you have other hearing-loss problems), but put it in a body shell that damps the vibration (not all will do so) or stand back from it, and you may not hear it.
Also, PWM isn’t just one frequency. At half throttle the frequency you would hear is the frequency of the overall wave. But at other speeds, part of the wave is on for less time (higher frequency) and part for longer (lower frequency). So for a 16 kHz “base frequency”, what’s actually being produced are sounds at two other frequencies: one down to 8 kHz and one up to 32 kHz. As the base frequency gets higher, more of the sound moves beyond the range of hearing (although as noted what that range is, is variable). To get everything above about 18 kHz, you’d need a PWM frequency of around 36 kHz (and I don’t know of any decoder that does that). So “supersonic” is something of a misnomer, although the high-frequency PWM called “supersonic” does reduce the amount of nose that’s audible.
High-frequency PWM has a limit. Because this is creating a high-frequency wave by turning the power on and off, the transistors that do that must operate at a fairly high speed. To create a 16 kHz wave, they must turn from off to on, and then back to off within that 62.5 microseconds, meaning that they’re switching once every 31.25 microseconds. That’s fast. Not incredibly fast by modern chip standards, but still fast. And to do that, a bit of hardware is counting clock pulses to time the length of the PWM pulse. That means the clock needs to be running fairly quickly. In fact, it takes a clock measured in megahertz to produce a kilohertz-level PWM signal with the 256 levels typical of BEMF-equipped decoders.
That “twice every 62.5 microseconds” is just for an output that is on exactly half the time (the “base frequency”). If you want it to be on shorter or longer, one part of the wave will have its “on” and “off” decisions made more closely together, requiring a higher switching speed (more expensive power transistors) and thus a faster clock speed (more expensive chip and circuit design). Ultimately there’s a cost to faster PWM.
There’s a formula for this (see my BEMF page for more detail). What it works out to is that for a PWM signal to have 128 steps in a 16 kHz signal it needs a clock running at about 2.05 MHz. Many BEMF control designs create additional “virtual” steps in between the real ones, to allow finer control. This has a direct effect on the clock speed required. To create one virtual step between each real one (meaning to use 256 motor-speed steps and to make the on/off decisions twice as fast), raises the requirement to 4.1 MHz. Changing the base motor frequency also affects the needed clock speed: going to 32 kHz with 256 steps doubles the needed clock to 8.2 MHz. There’s a very real cost to this, although it comes down every couple of years as chips get faster and cheaper. And with BEMF in the picture, it may be preferable to spend that extra capability on more speed steps for it, rather than on reducing the noise further with a higher PWM base frequency. The decisions involved in design of a motor decoder are not necessarily straightforward.
High frequency PWM also has a cost in torque. I won’t go into the details (I’m a bit vague on the magnitude and its relationship to frequency myself), but it has to do with the way the electric power in the motor creates a magnetic field. That takes time (remember magnetic “hysteresis” from high-school physics?). If you’re constantly turning it on and off, the field never builds to full strength, and that means there’s less power in the motor (less torque for pulling things). The higher the frequency, the shorter time the field is on and the more pronounced the loss of torque. So selecting a PWM frequency is a balancing act between the cost of the chip and the loss of torque on one hand, and the desire to reduce noise and gain more precise BEMF control on the other. Don’t assume that higher-frequency PWM is necessarily better. It may be, depending on the application, but that isn’t always going to be the case.
Still, I’m going to measure PWM frequency because it is easy to measure, and it lets me draw some comparisons. Just keep in mind that higher frequencies don’t necessarily directly mean better decoders or better operation of trains.
Test Setup
I wanted to take a look at some of the decoders I’m thinking of using, and see just what they were actually doing to control the motor. My test rig for this was simple: connect a decoder’s motor outputs to my test track, and put a DC locomotive on the track. This way the wires on the decoder stay in one place, and I could clip my oscilloscope to them. The decoder’s red and black wires could be moved from the “Rail” outputs of the Zephyr command station to the “Program” outputs to read and write CVs (I could also do Ops Mode writes while they were connected to the “Rail” outputs and the locomotive was running, to see the immediate effect of some changes).
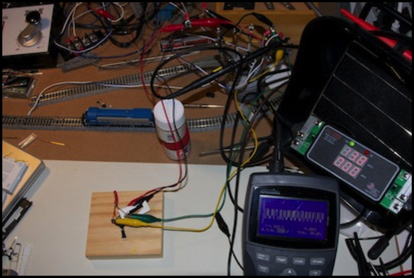
Decoder (on wood block) and test rig
In addition I had a computer running JMRI connected to the command station (via my LocoBuffer-USB as usual) so that I could do the programming there, and also so that I could see the commands being sent on the LocoNet, to know what speed step my throttle was currently sending to the decoder.
Note: in all tests below, the DC locomotive was running around the test track. Sometimes it was slower and/or louder, but it was always correctly operating.
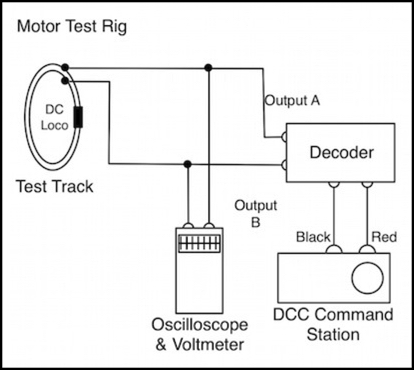
TCS M1
The TCS M1 is a slightly larger decoder than their newer Z2, and has more room for higher-power circuitry. It may also be able to operate at higher speeds (meaning with more PWM steps) as a result. Unfortunately they don’t document this, and my meter doesn’t have the resolution to let me estimate the number of speed steps it’s using internally in its BEMF algorithm. What I can see is that the base frequency of their PWM, as noted above, is 16 kHz. Here’s the scope trace showing this, at speed step 64:
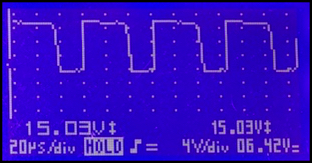
Throttle 64
I had the scope’s wires reversed relative to the motor polarity and didn’t notice initially, so my scope is reading upside down from what you might expect: when the wave is at the bottom, the voltage is at the number shown (15.03V DC), and when it’s at the top, it’s at 0.
Since the bottom of each spike is slightly wider than the top, you can see that it’s on for a little more than half the time. And the peak voltage is reading 15.03 volts (which is about right for my Zephyr; it was putting out 13.7V DCC, but that is a little higher measured peak-to-peak). I should note that the voltage scale on the scope isn’t always correct, as it will measure any noise or short-lived transient voltage as a higher peak, and it won’t report peaks that aren’t within the measurement period (basically the width of the screen).
The base frequency is measured by counting the time for a full on-off-on wave (really counting several and dividing by the number of them to get a more accurate result). This provides the wavelength, and one divided by the wavelength is the frequency of the wave. My scope isn’t the most exact one, so numbers are necessarily approximate, and I’m rounding them to the nearest thousand Hz in most cases for this post.
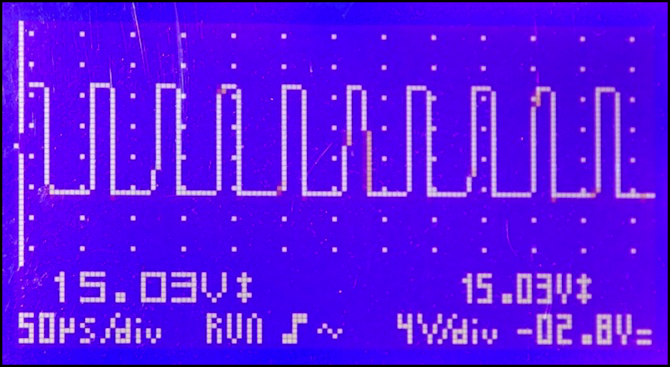
But how does this change with changes to the throttle (speed step)? The two measurements below show the same decoder at throttle settings of 32 and 98.
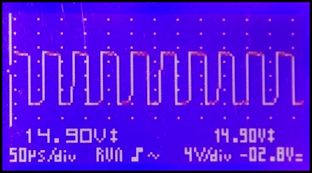
Throttle 32 (left) and 98 (right) out of 126 speed steps
In both of these, the frequency remains the same, but at 32 the throttle is on (at the bottom of the wave) for less of the time. While at 98, the interruptions in the output voltage are very short indeed.
The TCS is a pretty simple decoder. It only has one base frequency (16 kHz) and it’s very reliably providing power. I couldn’t catch the wave shutting off to measure motor speed for BEMF feedback (and BEMF was enabled).
TCS Z2
I did some additional testing with the TCS Z2, this time with my scope connected properly and taking in a broader view of the waveform at different timescales. The Z2 is a newer design decoder. This first set of images is for the decoder set to factory defaults, meaning that BEMF is enabled.
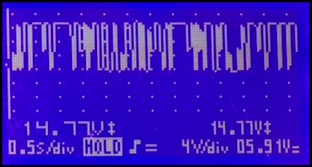
Z2 (default configuration) at 0.5 second (left) and 1 millisecond (right) timescales
Z2 (default configuration) at 0.001 second (left) and 0.000020 second (right) timescales
From this more complete picture, you can see how the Z2’s PWM output is arranged as a sequence of pulses lasting just over 60 microseconds (corresponding to a frequency of about 16 kHz) that in turn are broken up by periodic gaps lasting about 1.5 milliseconds (likely this is for BEMF sensing). Here the base pulses are on about 70% of the time between the gaps, to compensate for the longer periods during the gaps when power is off altogether.
Turning off BEMF (setting CV61=0) causes the older “dither” algorithm to be used in its place. This mainly applies at low speed, so it probably doesn’t have much affect at this speed. And, as you can see from the two traces below, there’s little if any difference here. Although not shown in this trace, the 1.5 msec gap was unchanged (actually, I managed a better measurement and it was more like 1.4 msec).
Z2 (no BEMF) at 0.5 seconds (left) and 0.000050 second (right) timescales
Finally, I disabled dither by setting CV56 to zero. And it was unchanged, complete with the ~1.4 msec gap.
Z2 (no BEMF or Dither) at 0.2 second (left) and 0.000500 second (right) timescales
So both the older M1 and the newer Z2 operate at a base frequency of around 16 kHz, and this isn’t altered by changing the speed step or by disabling BEMF or dither. I didn’t expect any of those changes to affect the frequency, but it’s nice to see it for myself.
DZ125
This is a relatively recent design Digitrax Decoder (the “5” is a generational number for them). Most of their generation 3/4/5 decoders have similar features, but this is of the most-recent generation and thus likely represents their current “best”, as least the best that will fit into this small size. Unlike many other Digitrax decoders that have 256 steps, this one claims to have 1024 steps (used for BEMF). Like the others it provides “supersonic” operation. As tested I took the defaults except where noted, so it’s using 128-speed steps (DCC throttle steps) with BEMF and supersonic PWM.
Note: I was testing a wire-in DZ125. Digitrax also makes the DZ125IN, with a six-pin connector for locomotives fitted with the appropriate socket, and I have one. But the interesting thing is that the data sheet for it only claims 256 steps, suggesting that there’s a difference between the two that goes beyond the pin vs wire aspect. I didn’t look into the DZ125IN this time, but I think I’ll take a look at how the two compare in the future.
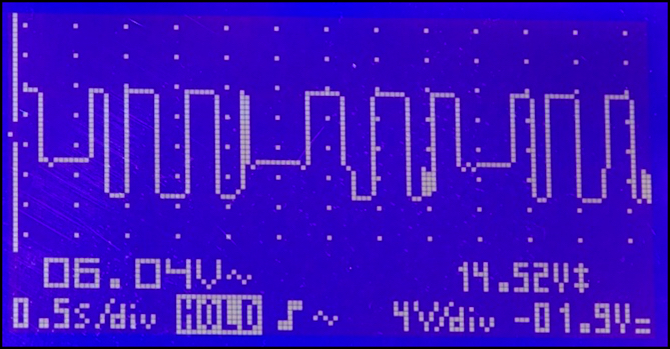
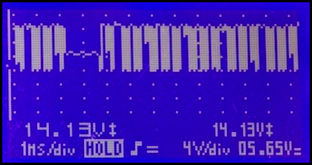
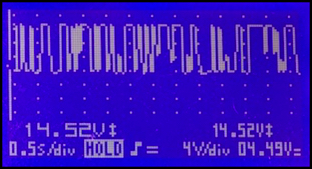
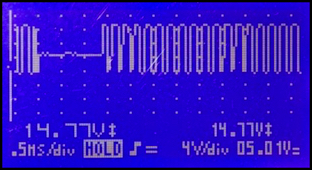
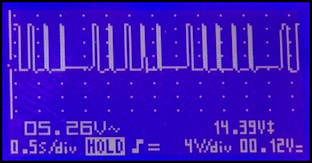
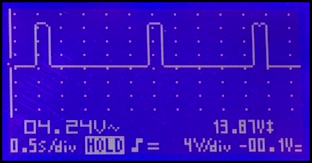
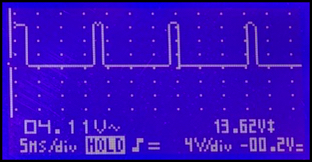
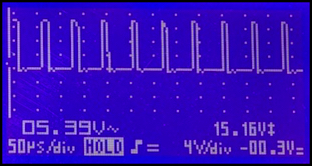
DZ125, throttle SS32, 0.5 second timescale
Note: the scope was set up to show AC RMS voltage (the 6.04 number in the image above), peak-to-peak (14.52V) and DC (-1.9V). The only one of these that’s really trustworthy is the peak-to-peak reading, and it will only measure what’s on-screen (or perhaps in a slightly longer capture buffer, the manual isn’t clear). The AC number is trying to estimate RMS AC, but it’s probably not doing a great job considering how much the numbers vary from sample to sample (that may be the “measure what’s onscreen” problem though). It provides a rough estimate of average voltage to the motor, although 6V seems a bit high for 1/4 throttle (but that could be due to BEMF). The DC number appears to be meaningless (the scope was referenced to the other motor lead; it’s possible this is measuring some asymmetry in the motor driver, but whatever it is it’s likely irrelevant).
As you can see from the image above, Digitrax has a somewhat different approach to PWM than TCS, with pulses arranged in sets with relatively long gaps between them, and periodic intervals of about a half-second where it looks like the voltage doesn’t drop to zero. I’m not quite sure what this last is, but I suspect it’s the motor acting as a generator for the BEMF sensing. However, it could be an artifact of the scope (see further down for other tests that don’t show it).
There’s one other thing that might be causing a problem in the above: for some reason the meter decided to switch to “AC coupling” (I had it set to DC). You can see that with the little sine wave in the bottom row center (to the right of the “HOLD” and the “S”-shaped trigger indicator). That’s an equals sign when it’s set to DC. It did that on a couple of the TCS traces too, but without any problems, so it may not be relevant. This is one of the things I don’t like about my scope. Even in fully-manual mode it sometimes changes what it’s doing and either won’t let me change it back, or I don’t notice until much later when I look at the traces.
DZ125, SS32, 0.005 second (left) and 0.000050 second (right) timescales
On a shorter timescale (left above), the pulses are revealed to be trains of shorter pulses with gaps between them. Note that these trains last about 15 msec, and the “pulses” in the trace above last around 150 - 200 msec, so each of the longer pulses is actually composed of sets of these sets. Finally, the right image shows that these fundamental pulses are simple full-voltage square waves on a cycle time of about 67 microseconds (15 kHz), and with a duty cycle of about 50%. The combination of these short breaks and the longer gaps are removing a bit more than 1/2 of the total power if the RMS voltage number in the long-timescale trace can be trusted. This isn’t too different from what the TCS decoders were doing, although TCS didn’t seem to have gaps longer than 250 msec (some of the Digitrax gaps are twice that). However I didn’t measure the TCS at step 32, and I probably need to do that for completeness.
Bottom line: there’s a simple train of pulses at a base PWM frequency that is “supersonic” (well, as supersonic as the TCS is). And there’s a periodic gap for BEMF sensing. Both of those are expected.
Since some of the more interesting aspects of the Digitrax decoders apply to handling of low speed operation, I re-did the above using speed step 8. This was chosen because the loco was barely crawling at this step (with the default speed table) but was running reliably.
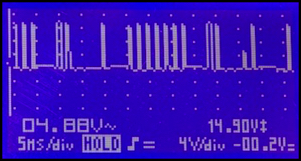
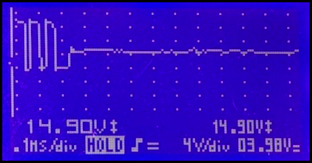
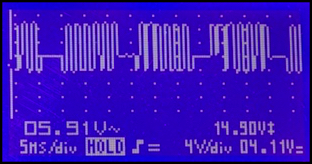
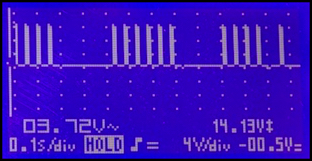
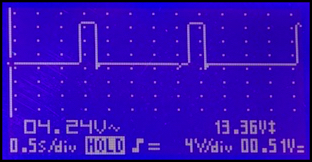
DZ125, SS8, 0.5 second timescale (left) and 0.005 second (right)
DZ125, SS8, 0.001 second (left) and 0.000050 second (right) timescales
These show the same structure. Reducing the speed step has reduced the length of the longer sets of pulses (visible in the half-second per division image at top left) while leaving the 3/4 second gap unchanged (it now seems to be at zero volts though; I’m not sure why it differs from the earlier one). The fundamental pulses are also shorter now, although still on the same frequency (or close to it; here it looks closer to 62 msec, of 16 kHz).
The DZ125 allows more control over the behavior of the decoder through programming CVs than the TCS decoders. You don’t necessarily need to have that control, and the defaults are likely fine for most people. But it’s nice to be able to get under the hood and tinker, at least if you’re like me and want to understand how these things work. So I wanted to see what adjusting the PWM frequency using CV09 would do.
Note: As I mention on my Mobile Decoders page, there’s an NMRA Recommended Practice for how CV09 is used, but Digitrax’s implementation doesn’t appear to follow it.
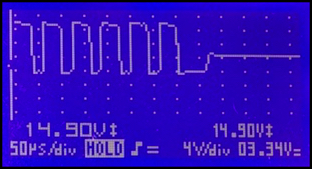
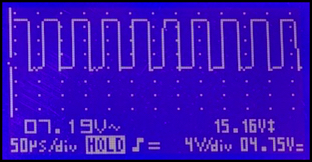
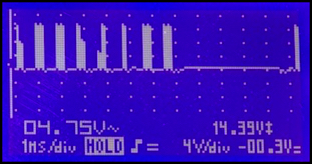
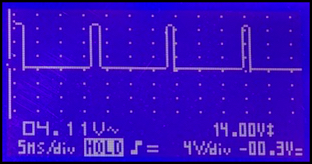
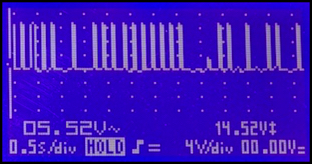
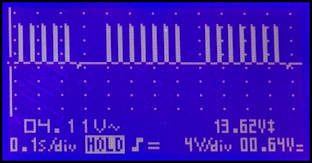
DZ125, SS8, PWM at 128, 0.500 second (left) and 0.100 second (right) timescales
DZ125, SS8, PWM at 128, 0.005 second timescale
With CV09=128, the waveform was now largely built of pulses on a 16 millisecond cycle, meaning the PWM frequency was around 60 Hz. But these were arranged into trains about 300 msec long separated by 250 msec gaps at some times, and by much longer 2-second gaps at others (both caught above). It seems to be a way to keep power in the individual pulses while still reducing the overall average, and I suspect this has some relation to what it takes to sustain the magnetic field in the motor. Note: I made a number of traces at shorter intervals, and found no small-scale structure in the 2 msec pulses shown here; they really are 2 millisecond pulses of full voltage.
When I set this the locomotive became noticeably louder, but also ran faster (I used Ops Mode programming, and the difference was very obvious the moment I pressed return to set the CV). That’s a bit odd, because the average voltage was lower (see the 0.5s/div graphs for this and the previous SS8 trace). This would appear to be the effect of having more torque at lower frequency PWM, and it’s interesting to see it first-hand like this.
The next thing to do was set CV9 to 255, which should “turn off” supersonic PWM entirely.

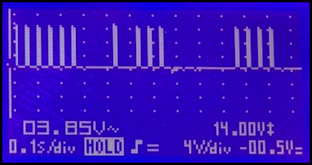
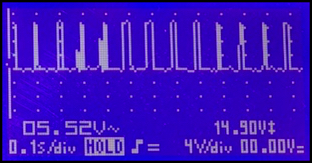
DZ125, SS8, PWM at 255, 0.500 second (left) and 0.100 second (right) timescales
DZ125, SS8, PWM at 255, 0.005 second timescale
The waveform wasn’t substantially different, however the number of spikes making up each set of long pulses appeared to be reduced. The calculated RMS voltage was slightly higher, which just makes me think I can’t really trust that number. The base frequency (interval of the cycle) was unchanged. I didn’t notice a significant change in locomotive operation from the previous test. The big difference seems to be that I had to use SS20 to get the same behavior I’d seen at SS8 with BEMF.
Another change I wanted to make was to leave PWM set to supersonic, but turn off BEMF by setting CV57 to 0. Unsurprisingly, this caused the locomotive to run much slower than supersonic with BEMF. In fact, it wouldn’t run at SS8 at all. I ended up setting SS20 which gave about the same speed. Lower steps might have worked, but I wasn’t trying to find the absolute lowest working step.
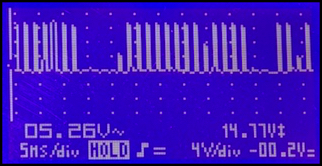
DZ125, SS20, supersonic, no BEMF, 0.500 second (left) and 0.100 second (right) timescales
DZ125, SS20, supersonic, no BEMF, 0.005 second (left) and 0.000050 second (right) timescales
This version has the “trains of pulses with 3/4 second gaps” of the earlier supersonic PWM measurements, but it seems to have more pulses. Each “pulse” is again composed of trains of shorter pulses (varying in duration up to about 500 microseconds) and those in turn are composed of the fundamental pulses (here around 10 microseconds in duration) on the base frequency, which is still around 16 kHz. The waveform wasn’t quite the same, but it was fairly close. And that’s what I would expect.
The final test was to turn of both “supersonic” and BEMF by setting CV9 to 255 and CV57 to 0.
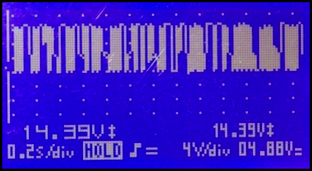
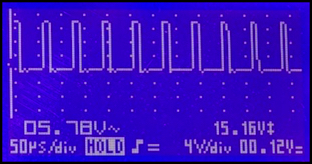
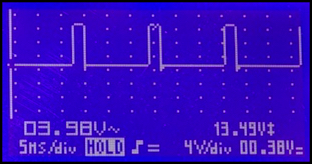
DZ125, SS20, no supersonic, no BEMF, 0.500 second (left) and 0.100 second (right) timescales
DZ125, SS20, no supersonic, no BEMF, 0.005 second timescale
This one has the same 60 Hz fundamental (I checked shorter timescales and found nothing), arranged into trains of several hundred milliseconds, but that was it, no other structure (note that the gaps between trains varied in length, as shown in the first and second traces here, with the trains appearing as a single pulse on the 0.5s/div scale). When I turned off supersonic PWM speed and noise levels increased (compared to the previous test). Note that again the computed RMS voltage went down, but that could be accurate since the lower-frequency PWM should be providing more torque to the motor for the same voltage (more efficiently using the voltage).
Summary
With the corrected Digitrax tests, this makes more sense now. Digitrax does have a different approach compared to TCS (which isn’t too surprising), even though both manufacturers are using 16 kHz to mean “supersonic”. Digitrax has a more complex structure to their waveform, and those ~300 msec trains could result in more noise, since they equate to frequencies around several thousand Hz, a range in which the human ear is very sensitive. That said, I haven’t done close comparisons between the two decoders with the same loco at the same speed, perhaps I will break out my Radio Shack sound meter and compare them more precisely in a future posting.
This testing has given me both insight into how PWM is used, as well as a bit more familiarity with the motor controllers of these two decoder families, knowledge I’ll use when doing my motor-decoder comparisons. And I expect to do these kinds of tests on other decoders, to see if there are other approaches to PWM in use, although my focus for now has been on the decoders I’m most likely to use.