


More About PWM
Update 3/16/13: Ok, my graphs (and some conclusions drawn from them) had a serious flaw. I’d modeled both the growth and decay curves incorrectly, and this caused current to drop to zero in a lot of situations where it wouldn’t have. Don provided an interesting simulator model, which led me to do some more reading and correct my model. It’s still not complete, but rather than re-do this post, I’m adding a new one that is the correction. I’ll leave this one here for history’s sake, but please see the new one.
I’ll start with my usual disclaimer: I’m not an electrical engineer. I think I know what I’m talking about, and my conclusions appear to line up with observed reality. But I could have fallen down the rabbit hole and just not noticed. Take it all with due caution and a grain of salt.
Before going back to my motor decoder testing, I decided I needed to better understand how PWM works, so I could more clearly interpret what I was seeing on my oscilloscope. This turned out to be a lot of work, because little is written that is directly applicable to the kind of DC motors used in trains. There is, however, a fair amount written about PWM, speed and torque in DC permanent-magnet motors, because they are used for servo motors (in robotics, among other things).
However, most writings about motors are at a fairly abstract level, focusing on the “what”, not the “why”, and conclusions drawn for a multi-amp motor designed to drive a robot arm slowly with a lot of torque may not be all that valid for a fractional-amp motor designed to move a small plastic model quickly, with relatively little torque. So I set off to figure out just what was going on inside my motors, and how to understand differences between individual designs.
If you want to see all the gory details, those and many others are collected on a new PWM page.
I came to several conclusions. First, PWM needs to be around 1 kHz (depending on the specific motor) if it’s to have a hope of properly energizing the windings in one turning at typical model train speeds. Really low-frequency PWM is likely to miss cycles, and that’s almost certainly bad from a performance standpoint due to friction and the drag of the train itself, which is there every cycle of the motor. Doing every third (or twentieth) cycle efficiently is of little value if you’re doing nothing at all on the others.
But once you get above a couple kHz, raising the PWM frequency has a significantly negative effect on torque produced by the motor. The reason is that torque depends on current, and current in a motor winding doesn’t simply depend on voltage, because the motor winding is an inductor. In an inductor, when a voltage is applied, current rises on an exponential curve until it gets to the maximum predicted by Ohm’s Law (I=V/R). That maximum, by the way, is the “stall current”. And because PWM pulses are fairly short, the current often doesn’t make it to the maximum it could before the pulse ends, and it always drops to zero long before the next pulse comes along.
A motor on DC that’s running with a less than maximum load won’t actually draw the stall current, for reasons having to do with the way back-EMF works. However, as load is added, the DC motor could get up to the stall current. I’ve largely ignored that aspect here, as back-EMF is only produced with current, so if the current can’t get higher to begin with, modifications of it due to back-EMF will be less significant.
A PWM-driven motor will never be as efficient as a motor driven with DC will be (well, except at near full throttle where the PWM is very close to acting like a DC supply). And that’s because of that delay in the rise of the current and the limited duration of the pulses. But this inefficiency becomes worse as the pulses become shorter (meaning at low throttle, where pulses are shorter than at higher throttle settings for the same frequency) or at higher PWM frequencies (where pulses are more numerous, but correspondingly shorter).
In sum, then, PWM is most inefficient at low throttle and at high frequencies, two commonly-stated limitations. But I wanted to understand the details of just why that is, for the specific motors I’m using.
Graphing Expected Current
I can’t actually measure the rise and fall of current in response to a PWM pulse. But there’s a formula I can use to determine it if I know the inductance and winding resistance of the motor, and my track voltage. Getting those wasn’t easy (I had to buy another meter, and take a bunch of trains apart). But it was possible. If you care about the numbers, I’ve listed them for several typical motors (along with per-motor versions of the charts below) below, and on my DC Train Motors page.
With those numbers in hand, I made a simple Excel spreadsheet to graph the developed current over time in response to PWM signals of typical voltage, duration, and frequency (I ignored back-EMF, so what these graphs show is the theoretical maximum, not the real current, which will be lower depending on the load on the motor). Since torque (which is a force) is proportional to current, one measure of interest is torque over time (known as “Impulse”). Impulse is a way to measure the energy transferred to an object. For the mathematically inclined, Impulse is the integral of torque (or other force) over time.
Put more simply: in the following diagrams, the amount of energy converted from electricity into a useful form by the motor per PWM interval (the impulse) is the area under the blue (current) curve on the graph, and this provides an indication of how much energy the motor is transferring to the train to counter friction or accelerate the train. If a motor wasn’t an inductor, then the blue curve would exactly match the green (voltage) curve. So the area under the green curve is the theoretical maximum impulse provided by the motor (on DC, you could get very close to that even with an inductor).
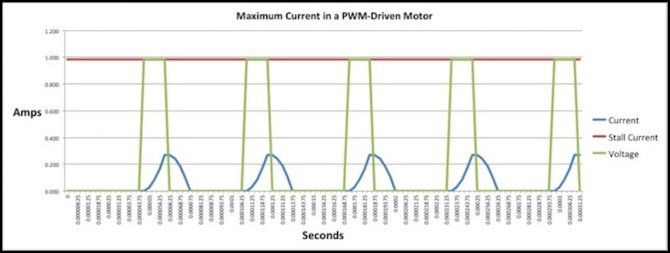
The following graph shows a typical motor (it’s based on the characteristics of one of my Kato E231 3-pole, skewed-winding motors), driven with a 1 kHz PWM set of pulses at 25% duty cycle, equating to 25% throttle if there is no BEMF compensation. As you can see, the blue curve lags behind the green curve a bit, but has close to the same area under it. So at this PWM frequency, the motor works pretty well, at least at 25% throttle (it’s worse at lower settings).
Note: in all these graphs, I’ve scaled the voltage line so it’s maximum was drawn at the stall current (maximum for the current line), to make the two easier to compare. In actuality, this line is going between zero and 12 volts in the model that created these charts.
E231 Motor, 1 kHz PWM, 25% Duty Cycle
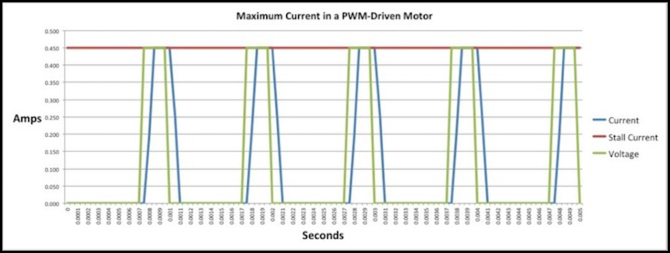
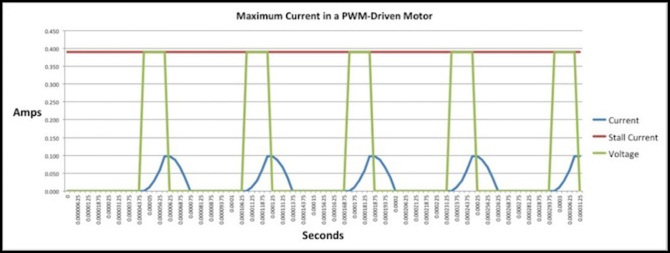
Now lets look at the same motor, also at 25% throttle, but with a 16 kHz PWM frequency, roughly that which I’ve observed on a couple of my existing DCC decoders that provide “supersonic” PWM. Here you can see the exponential shape of the current curve more clearly. Also note that the peak of the curve is barely above the 1/3 mark (34.4% to be precise), and the area under the blue curve is a small fraction of the area under the green curve. With supersonic PWM, the motor is transferring a lot less energy (i.e., is much less efficient) at lower voltages.
E231 Motor, 16 kHz PWM, 25% Duty Cycle
Now that might seem like a big problem (and it could be). But voltage doesn’t mean speed for a motor under load. It’s the current (torque) that produces speed, by acting against the drag of the train. So to get the same speed, the throttle just needs to be turned up higher. That is, if there’s a “higher” to use.
Ideally at higher throttle settings, the real impulse (area under blue curve) would more closely approximate the theoretical one (area under the green curve). If that’s the case, then at low speeds, just turn the knob up (a lot), but at higher speeds, just turn it up a little. There’s likely less total power even at close to full throttle, but if the areas are closer at higher throttles, the train will run reasonably fast (or pull a reasonably heavy load).
Note that this means that with PWM the train speed isn’t linear with the throttle setting (voltage percentage) the way it would be on DC. You need to turn the knob more at low speed than you do at high speed for the same increase.
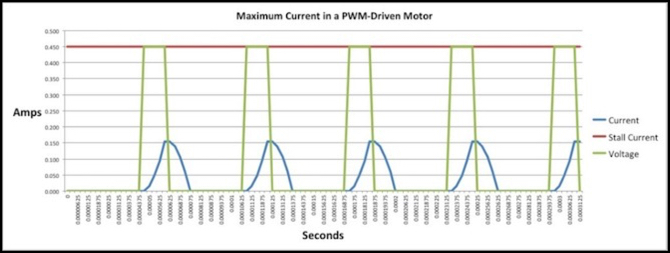
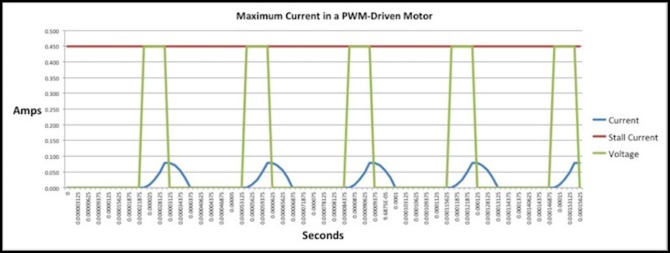
So at higher duty cycles, are the theoretical and actual impulses similar? Why yes, they are. Here’s the same motor, at 16 kHz, but at a 50% duty cycle. As you can see, the area under the two curves is very close to identical. Since the top of the blue curve is close to being a point rather than a flat line, we probably only just got to this level at close to half throttle. But that does mean for higher throttles we’re going to continue to be close to the maximum. That means this motor is going to work fairly well, even on 16 kHz PWM.
E231 Motor, 16 kHz PWM, 50% Duty Cycle
BEMF Compensation
In my earlier testing, I saw a substantial drop in speed if I shut off BEMF compensation. That’s because this feature is basically reacting to too little torque by increasing the duty cycle of the motor (i.e., “turning up the knob”). At lower speeds, BEMF compensation is going to have to be larger to overcome the lower ratio of actual impulse to theoretical impulse. At higher speeds it has less to do (although still not nothing) and so the effect of turning it off is less at high speeds than at low speeds. That’s what I observed previously, and what I’ve read in several places, and it’s exactly what I’d expect from these graphs.
And what this means is that BEMF compensation is more important with 16 kHz PWM than it would be with 1 kHz PWM (see the 1 KHz graph above). Which is one of those commonly-said things I always wanted to know the “why” of, and now I’ve got a pretty good idea.
3-pole versus 5-pole
Surprisingly, there was very little variation among all the motors I tested. It’s hardly a representative set, and clearly biased to more modern designs. But still, even if you look at the outliers in the table up at the top of the page, the two 5-pole motors (Kato SD80 and Atlas B23) they end up very similar to each other and to the three-pole motors, with the Kato freight locos having the most significant differences, and the Atlas B23 very similar to the Kato 3-pole motors despite claiming a 5-pole design (I didn’t take that one apart to check though).
Take a look at the 16 kHz E231 25% graph up above, and note that I said it was peaking at 34.4% of maximum current. Now here’s the same chart for the motor out of one of my Kato USA SD80 (actually, the numbers are nearly identical for both my Kato GG1 and a Kato SD80MAC, even though the motors aren’t identical):
SD80, 5-pole, straight, Motor, 16 kHz PWM, 25% Duty Cycle
In the graph above, current is peaking at about 27.4% of maximum which isn’t all that different, and the GG1 motor actually hit 35%. However something to note is that that’s 27% of a maximum that is higher (0.98 Amps stall current instead of 0.45 Amps). You’d need a beefier DCC decoder to drive this motor (in fact, to safely operate it on typical 15-16 V DCC systems you’d need a decoder rated for 1.5 Amps), but in return you’re getting a much larger impulse than with the 3-pole motors.
Now for the Atlas B23:
B23, 5-pole, skewed, Motor, 16 kHz PWM, 25% Duty Cycle
This one’s a much worse performer. Not only is it peaking at 25%, but that’s 25% of 0.39 Amps, the worst performer of any motor. So it’s not just “5-pole” design that’s giving the Kato freight locos a better performance spec, it’s also something to do with the winding design, that puts more current through the wire.
To be fair, however, I haven’t tested either for tractive effort, so I don’t know the Kato is better than the Atlas. And there’s a lot more than motor design involved in making a good loco, weight and gear ratio both have a strong effect. A few things I’ve read do suggest that others rate the Kato’s as “stronger” than the Atlas locos, but that’s very informal hearsay. Still, I think it’s safe to say that 5-pole motor design isn’t inherently better than 3-pole, it’s more complex than that.
There’s another thing I learned from these investigations: why Kato is using a three-pole motor for their DCC Friendly trains, when they previously used a 5-pole motor (and still use them on these North American prototype trains).
Clearly, the E231 motor is underpowered in comparison to Kato’s 5-pole designs, but it can make do with a smaller, simpler, and thus cheaper DCC decoder. Which is a very good reason to have changed motors when they started doing DCC. And their 3-pole design significantly outperforms the Atlas B23 (in terms of peak current in these estimates anyway) which has similar stall current.
Really High Frequency PWM
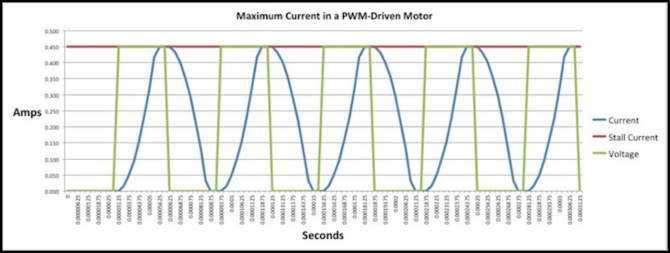
One last thing I wanted to look at was what effect really high frequency PWM is going to have, because that’s one of the features of Don’s Aegaeon:M decoder. So here’s my E231 motor on 32 kHz PWM. It’s down to 17.7% of peak current (from 34.4% at 16 kHz) at 25% throttle. That’s much worse than any motor at 16 kHz. This should translate into a significantly reduced top speed, and depending on how BEMF is implemented, perhaps significantly lower speeds for similar average voltage levels at lower speeds. This is definitely something I’m going to take a close look at.
E231 Motor, 32 kHz PWM, 25% Duty Cycle
Summary
So, having spent most of the last week reading about PWM and DC motor design, I think I’ve got a handle on it, or at least enough to understand my scope traces when I start working on the motor decoders. And I now have a way to graph individual motors so I can see the torque effect of different PWM frequencies, and compare that to my observed train behavior. Since these graphs are somewhat idealized, that won’t be a perfect match, but it will help me (I hope) to understand what’s going on.
In a sense I didn’t really learn anything new. What I’ve done is confirmed for myself that a number of common statements about DCC decoders, PWM and small motors were correct. But I’ve also quantified things for the specific motors that are of the most interest for me, and given myself a simple way to illustrate what those numbers mean; I’m always happier looking at a drawing than trying to interpret numbers directly.
Now I need to get started on the actual motor decoder testing.